This post is where all basic information is stored so that you can easily understand what I am talking about.
Introduction to Signals
1. A signal is a sequence of numbers
2. A signal consists is measured along two dimensions – displacement and time.

4. A digital signal has discrete displacements at discrete time intervals. Its values are limited to a given set and are observed at fixed intervals in time.
5. A signal can be discrete in amplitude, but continuous in time, or continuous in amplitude but discrete in time.
References
Digital Signal Processing: DSP & Applications
by Day Stranneby, 2001
Introduction to Oscillations
1. A cycle is a complete oscillation about an equilibrium position, 0. In chart 1, the signal completes one cycle somewhere between time 5 and 6.
2. The period of an oscillator is the amount of time needed to complete one cycle.
3. The frequency of an oscillator is the number of complete cycles per time interval. It is the inverse of period or (1/period).
4. The amplitude of an oscillator is the maximum displacement about the equilibrium position, 0.
*Intuitively, real values or numbers are not discrete and can exist in infinitely small intervals.
Introduction to Complex Numbers
1. A complex number has the form x+yi, where x is the real coefficient and y is the imaginery coefficient of the complex number. i is defined as the square root of -1 or √-1. Thus all real numbers have an imaginery coefficient of 0.
2. Complex numbers were originally created to solve certain polynomial functions. Consider the equation x2+1=0, whose solution is √-1 - a complex number.
3. Complex numbers are always plotted on the complex plane or in an argand diagram with the y axis being the imaginary coefficient and the x axis being the real coefficient.
3. In signal processing, complex numbers allow signals to be represented in a coordinate system, where the signal at any one point in time is represented by a real and imaginery component. Such representation allows for easy manipulation of 'complex frequencies' as we shall see later.
Suppose you have a sine function as a signal, y=sin(2πft), where f is the frequency of your signal. You will observe the following signal if frequency = 1, or 1 cycle is completed within 1 time interval.

As the signal is repetitive, the same signal can be represented via the argand diagram below. The radius of the circle represents the signal amplitude, while the angle θ theta = 2πft.

4. Upon closer study of the diagram above, we will realize that the Euler's identity, eiθ=cosθ+isinθ, is another representation of complex numbers. Note that cosθ=sin(θ+π/2).
5. Suppose we have a complex frequency f=a+ib so that we have a signal represented by est.
est=e(a+ib)t
=eateibt
=eat[cos(bt)+isin(bt)]
We know from previously that cos(bt)+isin(bt) creates a signal of constant frequency on the real plane like for instance, either of the two signals below.

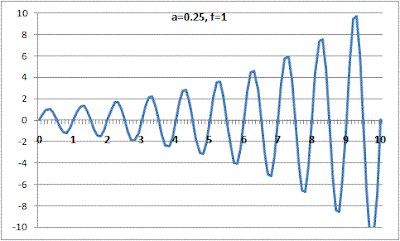
However, multiplying [cos(bt)+isin(bt)] by eat creates a signal with varying frequency over time depending on the value of a such as the example below.

References
Digital Signal Processing Fundamentals by Ashfaq A Khan
Like what you have just read? Digg it or Tip'd it.
The objective of Finance4Traders is to help traders get started by bringing them unbiased research and ideas. Since late 2005, I have been developing trading strategies on a personal basis. Not all of these models are suitable for me, but other investors or traders might find them useful. After all, people have different investment/trading goals and habits. Thus, Finance4Traders becomes a convenient platform to disseminate my work...(Read more about Finance4Traders)

0 comments:
Post a Comment