Financial time series such as price data are in general digital signals. They can only take on a set range of values and can only be measured at discrete time intervals. Even tick data is digital. It is merely sampled at very small time intervals, i.e. the machine records the prevailing quote every millisecond and only shows you those that have changed.
Visit HERE for introductory information on signal processing and the terminology used here.
In fact any time series can be viewed as the summation of an infinite number of sine and cosine waves of varying amplitudes, phases and frequencies even if it is not periodic. A technique to break down a time series to its component sinusoidal waves is known as the Fourier transform. From this perspective, I assert that any particular financial time series may be characterised by waves of certain dominant frequencies. Understanding how a particular technical indicator and its parameters interact with these dominant frequencies can help the trader understand if his chosen indicator is extracting the information he or she wants.
Suppose the market goes through a mini cycle every 2 weeks, a 200 week moving average will never be able to identify the peaks and troughs of this mini cycle. The design of indicators may limit its ability to capture frequency dynamics within a certain bandwidth only. For example, a n period simple moving average will not be able to capture the cyclicity of a n period cycle as well as that of integer multiples of n period cycles.
An article HERE explains fitlers in trading and how they are classified within the time domain. The current article that you are reading elaborates on filters in the frequency domain. Filters and signals can be analyzed within the frequency or time/temproral domain.
In the frequency domain, filters are typically classified into low-band pass and high-band pass filters. A low-band pass filter tends to capture the low frequency dynamics of a signal, while a high-band pass filter captures the high frequency components of a signal. The following sections will help you understand what I mean.
Frequency Domain
The process of classifying filters in the frequency domain begins by feeding a signal xt of a known frequency into the filter.
xt=ei2πft
Using the Euler's identity, ei2πft actually equals cos(2πft)+isin(2πft) which produces signals like below, depending on the frequency of the signal. [This article here explains more about the role of the Euler's identity in signal processing.]

Using the 3 period simple moving average indicator in our previous article on filters and technical indicators, we obtain the following.

The function H(f) is the frequency response function or the transfer function of the signal and has the general form.

H(f) can be further broken into two parts - the gain function G(f) and phase angle θ as shown below.

In the case of the 3 period simple moving average, the gain function G(f) and phase angle of the filter θ are as follows,

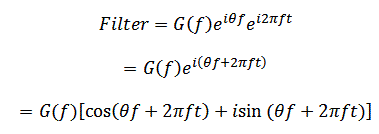
The G(f) and θ that I work out above might not be accurate. While, I have retained the meaning behind these functions, I have not had them proof-read and they are for illustrative purpose only. If we fit H(f) and its component G(f) and θ back into the original filter

Recall that the original signal xt=ei2πft or xt=cos(2πft)+isin(2πft). Hence, we now know that the three period simple moving average changes the the original signal by G(f) and introduces a phase shift of θf.
A high-band pass filter will have a G(f) whose magnitude is close to 1 at higher frequencies and a G(f) of magnitude approximately 0 at lower frequencies. The reverse applies to low-band pass filters. The magnitude of G(f) is calculated as √[(real coefficient)2+(imaginery coefficient)2]. The real and imaginery coefficients refer to the respective components of the G(f) function.
Intuitively, the product of 2 complex numbers (a+bi) and (c+di) is equal to (ac-bd)+(bc+ad)i. The magnitude of (ac-bd)+(bc+ad)i is equal to the product of the magnitudes of (a+bi) and (c+di). Recall that a time series can be viewed as a combination of signals with different frequencies. Hence, the outputs of a filter whose gain function G(f) has a magnitude of 1 at frequency f best reflect the component signal of that frequency. If θf is not zero, this means that the indicator shifts the phase of the input signal and and lags the input signal by θf/2π of a cycle.
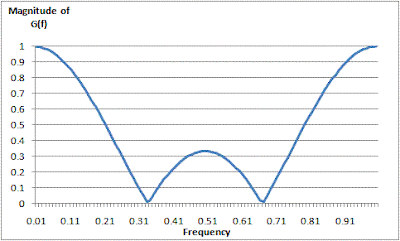
The chart below is called a gain diagram and it shows the magnitude of the gain function of a 3 period simple moving average aginst the signal xt=ei2πft at varying frequencies. As can be observed, the gain function is approximately 0 at frequencies of 0.333 and 0.666, meaning that this indicator is unable to sufficiently reflect the dynamics of a 3 period and 6 period cycle.

Conclusion
While it seems like overkill to go through such complicated mathematics just to show that there is little utility in using a 3 period moving average in a 3 period cycle, the method described here can be applied to test other indicators for their ability to capture market cycles. An example is the exponential moving average whose gain diagram looks like the below. The exponential moving average due to its design is able to capture at least some of the dynamics of a wide range of frequencies and is less limited by its averaging period.

References
An Introduction to Wavelets and Other Filtering Methods in Finance and Economics by Ramazan Gencay, Faruk Selcuk and Brandon Whitcher
Like what you have just read? Digg it or Tip'd it.
The objective of Finance4Traders is to help traders get started by bringing them unbiased research and ideas. Since late 2005, I have been developing trading strategies on a personal basis. Not all of these models are suitable for me, but other investors or traders might find them useful. After all, people have different investment/trading goals and habits. Thus, Finance4Traders becomes a convenient platform to disseminate my work...(Read more about Finance4Traders)

0 comments:
Post a Comment